wtf8 wtf3-pseudo
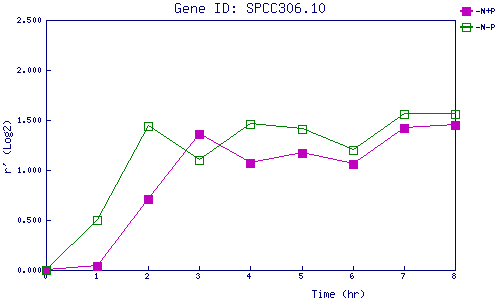
| 0 | 1 | 2 | 3 | 4 | 5 | 6 | 7 | 8 | |
| -N+P | 0.000 | 0.043 | 0.707 | 1.359 | 1.068 | 1.171 | 1.058 | 1.422 | 1.451 |
| -N-P | 0.000 | 0.502 | 1.436 | 1.097 | 1.457 | 1.414 | 1.197 | 1.558 | 1.559 |
|
-N+P: Nitrogen starved in the presence of P-factor -N-P: Nitrogen starved in the absence of P-factor |