sds21
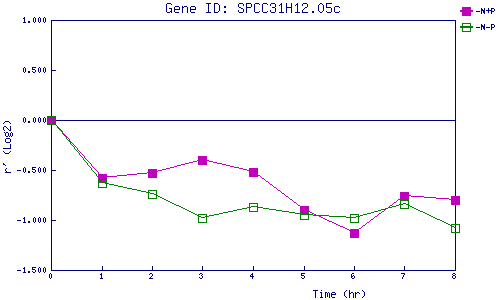
| 0 | 1 | 2 | 3 | 4 | 5 | 6 | 7 | 8 | |
| -N+P | 0.000 | -0.584 | -0.534 | -0.399 | -0.515 | -0.896 | -1.127 | -0.761 | -0.795 |
| -N-P | 0.000 | -0.628 | -0.737 | -0.983 | -0.874 | -0.946 | -0.978 | -0.839 | -1.075 |
|
-N+P: Nitrogen starved in the presence of P-factor -N-P: Nitrogen starved in the absence of P-factor |