sec231 sec23a
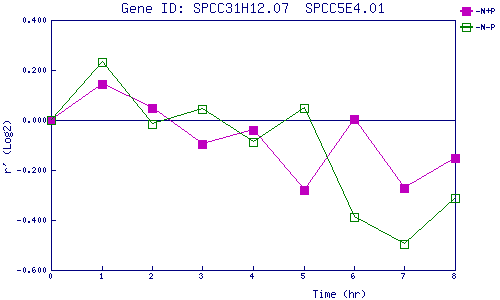
| 0 | 1 | 2 | 3 | 4 | 5 | 6 | 7 | 8 | |
| -N+P | 0.000 | 0.144 | 0.046 | -0.098 | -0.040 | -0.280 | 0.003 | -0.271 | -0.154 |
| -N-P | 0.000 | 0.231 | -0.017 | 0.045 | -0.090 | 0.047 | -0.387 | -0.495 | -0.312 |
|
-N+P: Nitrogen starved in the presence of P-factor -N-P: Nitrogen starved in the absence of P-factor |