| 0 | 1 | 2 | 3 | 4 | 5 | 6 | 7 | 8 | |
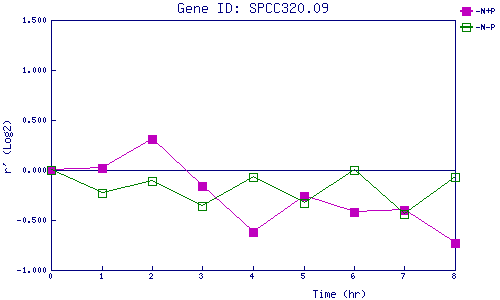
| -N+P | 0.000 | 0.019 | 0.308 | -0.162 | -0.625 | -0.265 | -0.419 | -0.403 | -0.734 |
| -N-P | 0.000 | -0.226 | -0.106 | -0.363 | -0.073 | -0.328 | 0.000 | -0.435 | -0.068 |
|
-N+P: Nitrogen starved in the presence of P-factor -N-P: Nitrogen starved in the absence of P-factor |