srp72
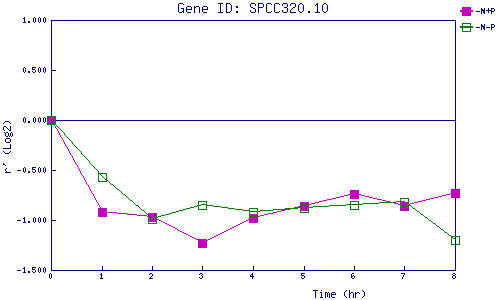
| 0 | 1 | 2 | 3 | 4 | 5 | 6 | 7 | 8 | |
| -N+P | 0.000 | -0.922 | -0.974 | -1.229 | -0.978 | -0.859 | -0.736 | -0.860 | -0.727 |
| -N-P | 0.000 | -0.568 | -0.987 | -0.854 | -0.920 | -0.884 | -0.852 | -0.815 | -1.200 |
|
-N+P: Nitrogen starved in the presence of P-factor -N-P: Nitrogen starved in the absence of P-factor |