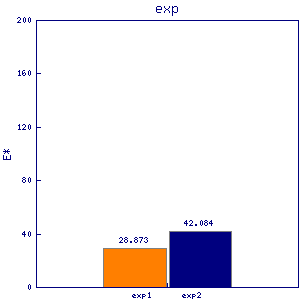
ura4
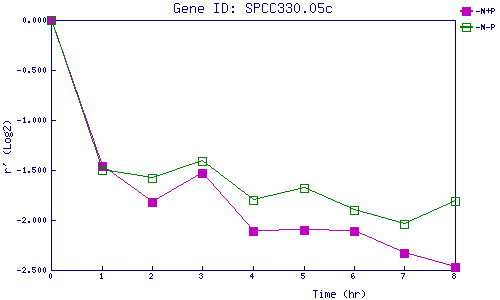
| 0 | 1 | 2 | 3 | 4 | 5 | 6 | 7 | 8 | |
| -N+P | 0.000 | -1.465 | -1.820 | -1.531 | -2.110 | -2.099 | -2.109 | -2.327 | -2.467 |
| -N-P | 0.000 | -1.495 | -1.576 | -1.411 | -1.797 | -1.682 | -1.895 | -2.037 | -1.814 |
|
-N+P: Nitrogen starved in the presence of P-factor -N-P: Nitrogen starved in the absence of P-factor |