| 0 | 1 | 2 | 3 | 4 | 5 | 6 | 7 | 8 | |
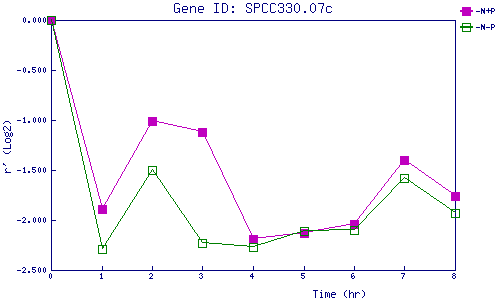
| -N+P | 0.000 | -1.889 | -1.015 | -1.125 | -2.192 | -2.133 | -2.042 | -1.396 | -1.758 |
| -N-P | 0.000 | -2.287 | -1.501 | -2.228 | -2.269 | -2.107 | -2.101 | -1.585 | -1.930 |
|
-N+P: Nitrogen starved in the presence of P-factor -N-P: Nitrogen starved in the absence of P-factor |