alg11 gmd3
| 0 | 1 | 2 | 3 | 4 | 5 | 6 | 7 | 8 | |
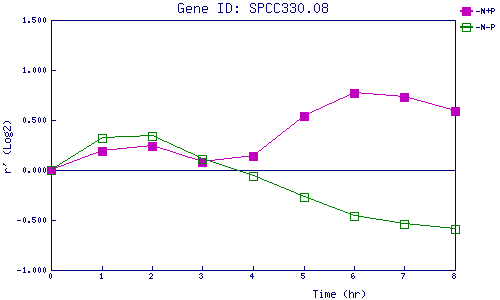
| -N+P | 0.000 | 0.191 | 0.235 | 0.084 | 0.143 | 0.540 | 0.767 | 0.730 | 0.588 |
| -N-P | 0.000 | 0.316 | 0.339 | 0.114 | -0.059 | -0.266 | -0.465 | -0.543 | -0.591 |
|
-N+P: Nitrogen starved in the presence of P-factor -N-P: Nitrogen starved in the absence of P-factor |