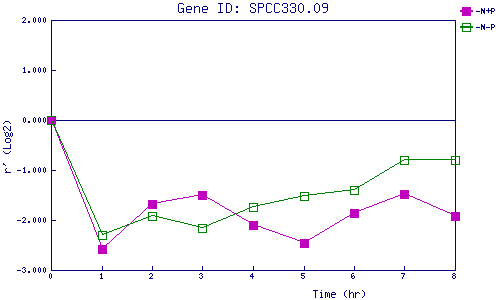
| 0 | 1 | 2 | 3 | 4 | 5 | 6 | 7 | 8 | |
| -N+P | 0.000 | -2.574 | -1.691 | -1.506 | -2.099 | -2.461 | -1.852 | -1.484 | -1.924 |
| -N-P | 0.000 | -2.306 | -1.914 | -2.160 | -1.747 | -1.525 | -1.410 | -0.799 | -0.804 |
|
-N+P: Nitrogen starved in the presence of P-factor -N-P: Nitrogen starved in the absence of P-factor |