pcm1
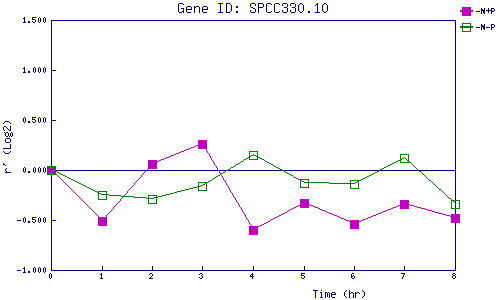
| 0 | 1 | 2 | 3 | 4 | 5 | 6 | 7 | 8 | |
| -N+P | 0.000 | -0.511 | 0.064 | 0.258 | -0.601 | -0.327 | -0.535 | -0.340 | -0.481 |
| -N-P | 0.000 | -0.249 | -0.294 | -0.157 | 0.146 | -0.126 | -0.142 | 0.116 | -0.340 |
|
-N+P: Nitrogen starved in the presence of P-factor -N-P: Nitrogen starved in the absence of P-factor |