rpc37
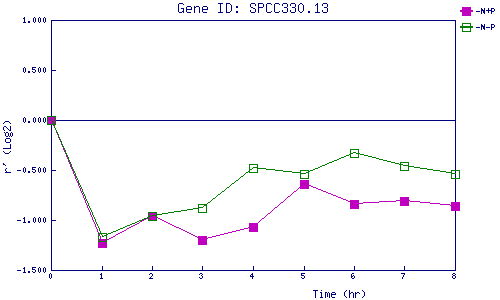
| 0 | 1 | 2 | 3 | 4 | 5 | 6 | 7 | 8 | |
| -N+P | 0.000 | -1.231 | -0.961 | -1.201 | -1.072 | -0.639 | -0.837 | -0.814 | -0.859 |
| -N-P | 0.000 | -1.169 | -0.961 | -0.884 | -0.477 | -0.542 | -0.330 | -0.461 | -0.538 |
|
-N+P: Nitrogen starved in the presence of P-factor -N-P: Nitrogen starved in the absence of P-factor |