cid2
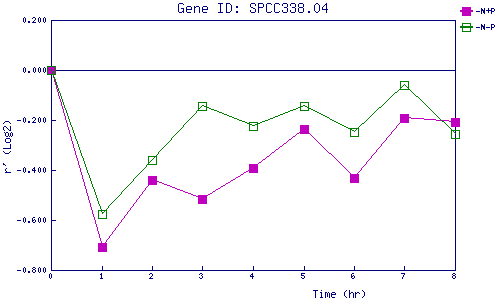
| 0 | 1 | 2 | 3 | 4 | 5 | 6 | 7 | 8 | |
| -N+P | 0.000 | -0.708 | -0.438 | -0.515 | -0.390 | -0.237 | -0.433 | -0.191 | -0.206 |
| -N-P | 0.000 | -0.576 | -0.358 | -0.145 | -0.225 | -0.142 | -0.248 | -0.061 | -0.257 |
|
-N+P: Nitrogen starved in the presence of P-factor -N-P: Nitrogen starved in the absence of P-factor |