spm2 mms2
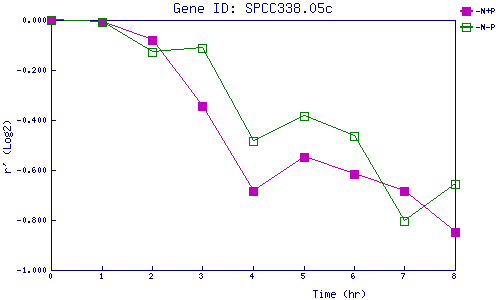
| 0 | 1 | 2 | 3 | 4 | 5 | 6 | 7 | 8 | |
| -N+P | 0.000 | -0.008 | -0.079 | -0.342 | -0.683 | -0.547 | -0.614 | -0.685 | -0.850 |
| -N-P | 0.000 | -0.006 | -0.127 | -0.112 | -0.484 | -0.385 | -0.465 | -0.803 | -0.657 |
|
-N+P: Nitrogen starved in the presence of P-factor -N-P: Nitrogen starved in the absence of P-factor |