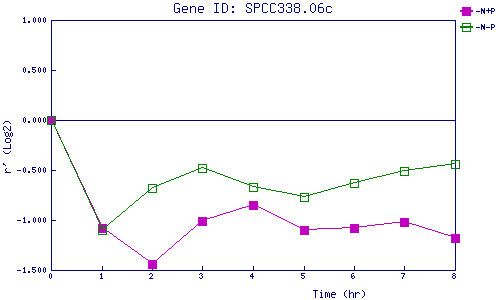
| 0 | 1 | 2 | 3 | 4 | 5 | 6 | 7 | 8 | |
| -N+P | 0.000 | -1.080 | -1.445 | -1.006 | -0.854 | -1.099 | -1.080 | -1.024 | -1.177 |
| -N-P | 0.000 | -1.104 | -0.676 | -0.482 | -0.668 | -0.767 | -0.627 | -0.509 | -0.444 |
|
-N+P: Nitrogen starved in the presence of P-factor -N-P: Nitrogen starved in the absence of P-factor |