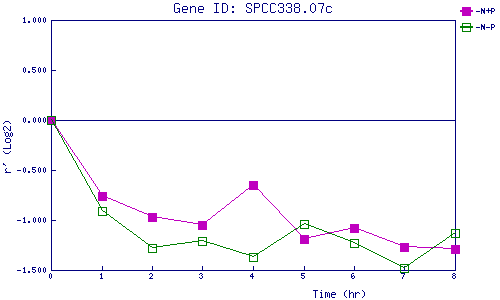
| 0 | 1 | 2 | 3 | 4 | 5 | 6 | 7 | 8 | |
| -N+P | 0.000 | -0.765 | -0.972 | -1.051 | -0.650 | -1.194 | -1.084 | -1.269 | -1.288 |
| -N-P | 0.000 | -0.913 | -1.283 | -1.206 | -1.368 | -1.039 | -1.235 | -1.480 | -1.126 |
|
-N+P: Nitrogen starved in the presence of P-factor -N-P: Nitrogen starved in the absence of P-factor |