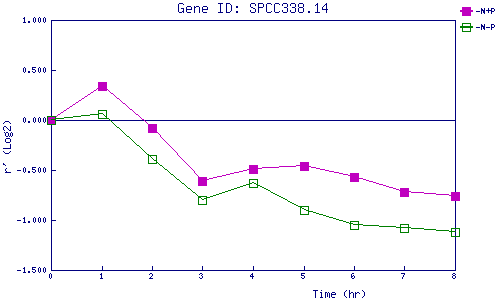
| 0 | 1 | 2 | 3 | 4 | 5 | 6 | 7 | 8 | |
| -N+P | 0.000 | 0.337 | -0.085 | -0.610 | -0.494 | -0.462 | -0.572 | -0.725 | -0.755 |
| -N-P | 0.000 | 0.055 | -0.394 | -0.798 | -0.630 | -0.901 | -1.051 | -1.075 | -1.120 |
|
-N+P: Nitrogen starved in the presence of P-factor -N-P: Nitrogen starved in the absence of P-factor |