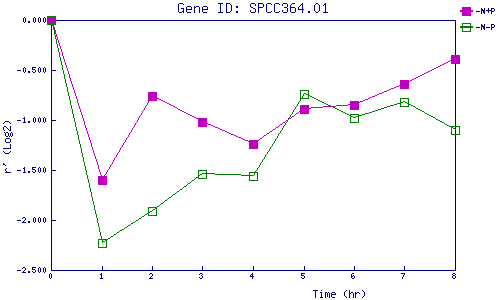
| 0 | 1 | 2 | 3 | 4 | 5 | 6 | 7 | 8 | |
| -N+P | 0.000 | -1.595 | -0.765 | -1.024 | -1.237 | -0.893 | -0.850 | -0.639 | -0.389 |
| -N-P | 0.000 | -2.233 | -1.909 | -1.535 | -1.563 | -0.739 | -0.975 | -0.824 | -1.102 |
|
-N+P: Nitrogen starved in the presence of P-factor -N-P: Nitrogen starved in the absence of P-factor |