| 0 | 1 | 2 | 3 | 4 | 5 | 6 | 7 | 8 | |
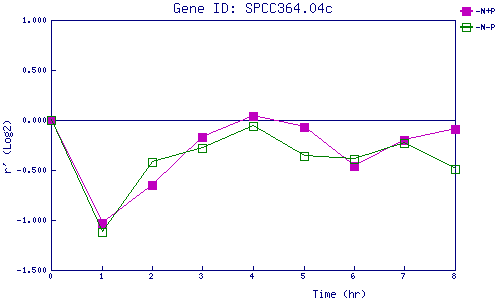
| -N+P | 0.000 | -1.033 | -0.648 | -0.169 | 0.045 | -0.069 | -0.456 | -0.196 | -0.089 |
| -N-P | 0.000 | -1.116 | -0.419 | -0.285 | -0.056 | -0.362 | -0.390 | -0.231 | -0.492 |
|
-N+P: Nitrogen starved in the presence of P-factor -N-P: Nitrogen starved in the absence of P-factor |
