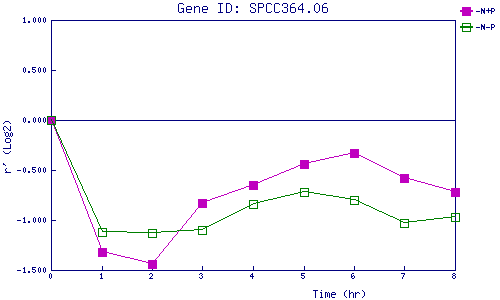
| 0 | 1 | 2 | 3 | 4 | 5 | 6 | 7 | 8 | |
| -N+P | 0.000 | -1.315 | -1.440 | -0.834 | -0.650 | -0.438 | -0.332 | -0.581 | -0.723 |
| -N-P | 0.000 | -1.116 | -1.133 | -1.098 | -0.843 | -0.718 | -0.796 | -1.029 | -0.968 |
|
-N+P: Nitrogen starved in the presence of P-factor -N-P: Nitrogen starved in the absence of P-factor |