reserved_name_cfh2
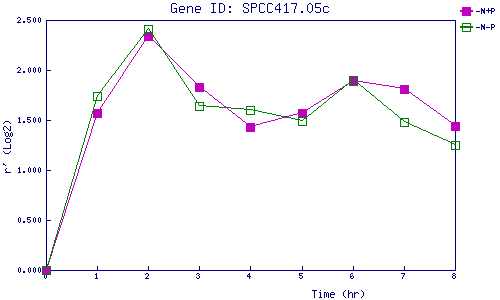
| 0 | 1 | 2 | 3 | 4 | 5 | 6 | 7 | 8 | |
| -N+P | 0.000 | 1.567 | 2.338 | 1.833 | 1.429 | 1.571 | 1.893 | 1.811 | 1.439 |
| -N-P | 0.000 | 1.737 | 2.412 | 1.645 | 1.602 | 1.489 | 1.904 | 1.484 | 1.248 |
|
-N+P: Nitrogen starved in the presence of P-factor -N-P: Nitrogen starved in the absence of P-factor |