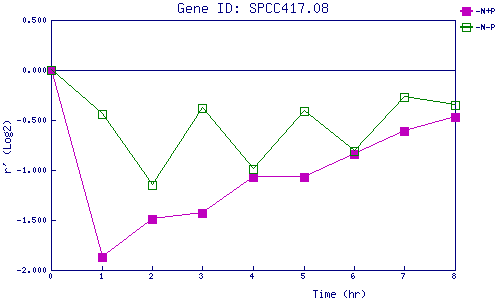
| 0 | 1 | 2 | 3 | 4 | 5 | 6 | 7 | 8 | |
| -N+P | 0.000 | -1.866 | -1.492 | -1.426 | -1.067 | -1.073 | -0.842 | -0.610 | -0.467 |
| -N-P | 0.000 | -0.436 | -1.149 | -0.384 | -0.987 | -0.406 | -0.809 | -0.267 | -0.347 |
|
-N+P: Nitrogen starved in the presence of P-factor -N-P: Nitrogen starved in the absence of P-factor |