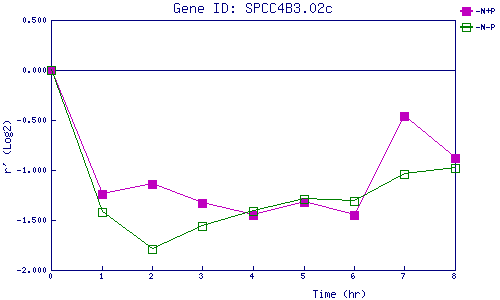
| 0 | 1 | 2 | 3 | 4 | 5 | 6 | 7 | 8 | |
| -N+P | 0.000 | -1.244 | -1.140 | -1.334 | -1.454 | -1.322 | -1.454 | -0.458 | -0.876 |
| -N-P | 0.000 | -1.420 | -1.788 | -1.559 | -1.411 | -1.293 | -1.309 | -1.038 | -0.981 |
|
-N+P: Nitrogen starved in the presence of P-factor -N-P: Nitrogen starved in the absence of P-factor |