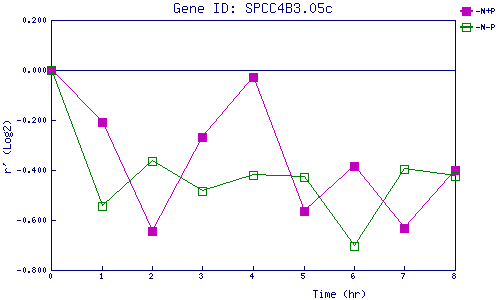
| 0 | 1 | 2 | 3 | 4 | 5 | 6 | 7 | 8 | |
| -N+P | 0.000 | -0.206 | -0.643 | -0.267 | -0.029 | -0.563 | -0.382 | -0.631 | -0.402 |
| -N-P | 0.000 | -0.542 | -0.365 | -0.485 | -0.420 | -0.427 | -0.703 | -0.396 | -0.423 |
|
-N+P: Nitrogen starved in the presence of P-factor -N-P: Nitrogen starved in the absence of P-factor |