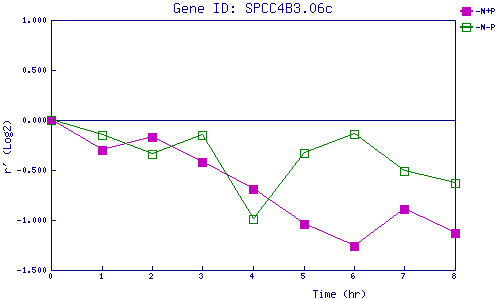
| 0 | 1 | 2 | 3 | 4 | 5 | 6 | 7 | 8 | |
| -N+P | 0.000 | -0.301 | -0.167 | -0.419 | -0.693 | -1.035 | -1.259 | -0.889 | -1.132 |
| -N-P | 0.000 | -0.153 | -0.337 | -0.151 | -0.994 | -0.334 | -0.141 | -0.513 | -0.628 |
|
-N+P: Nitrogen starved in the presence of P-factor -N-P: Nitrogen starved in the absence of P-factor |