| 0 | 1 | 2 | 3 | 4 | 5 | 6 | 7 | 8 | |
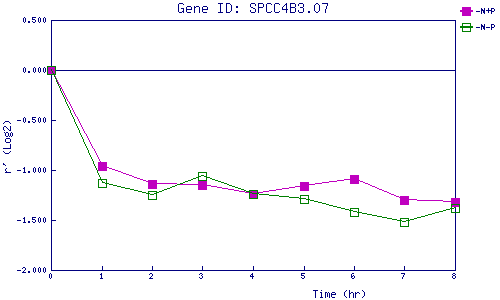
| -N+P | 0.000 | -0.961 | -1.136 | -1.148 | -1.240 | -1.155 | -1.091 | -1.297 | -1.321 |
| -N-P | 0.000 | -1.131 | -1.254 | -1.060 | -1.242 | -1.292 | -1.418 | -1.525 | -1.379 |
|
-N+P: Nitrogen starved in the presence of P-factor -N-P: Nitrogen starved in the absence of P-factor |