| 0 | 1 | 2 | 3 | 4 | 5 | 6 | 7 | 8 | |
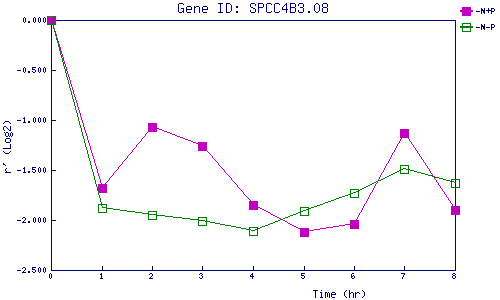
| -N+P | 0.000 | -1.678 | -1.072 | -1.255 | -1.850 | -2.122 | -2.035 | -1.133 | -1.896 |
| -N-P | 0.000 | -1.879 | -1.950 | -2.007 | -2.112 | -1.906 | -1.734 | -1.494 | -1.629 |
|
-N+P: Nitrogen starved in the presence of P-factor -N-P: Nitrogen starved in the absence of P-factor |