| 0 | 1 | 2 | 3 | 4 | 5 | 6 | 7 | 8 | |
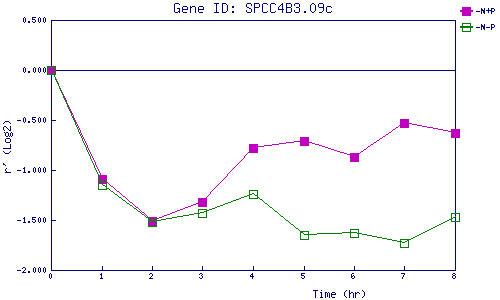
| -N+P | 0.000 | -1.093 | -1.506 | -1.318 | -0.782 | -0.709 | -0.867 | -0.526 | -0.630 |
| -N-P | 0.000 | -1.150 | -1.524 | -1.429 | -1.237 | -1.652 | -1.630 | -1.730 | -1.470 |
|
-N+P: Nitrogen starved in the presence of P-factor -N-P: Nitrogen starved in the absence of P-factor |