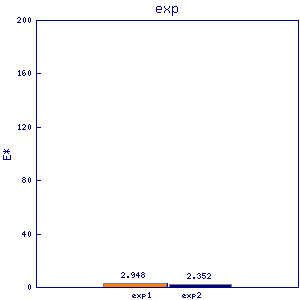
ipk1
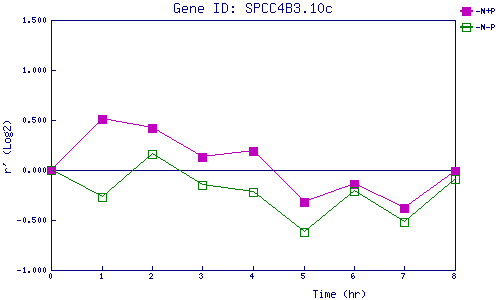
| 0 | 1 | 2 | 3 | 4 | 5 | 6 | 7 | 8 | |
| -N+P | 0.000 | 0.514 | 0.416 | 0.130 | 0.191 | -0.320 | -0.138 | -0.382 | -0.014 |
| -N-P | 0.000 | -0.274 | 0.156 | -0.147 | -0.218 | -0.616 | -0.207 | -0.517 | -0.086 |
|
-N+P: Nitrogen starved in the presence of P-factor -N-P: Nitrogen starved in the absence of P-factor |