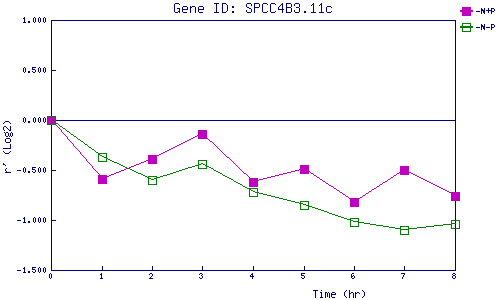
| 0 | 1 | 2 | 3 | 4 | 5 | 6 | 7 | 8 | |
| -N+P | 0.000 | -0.592 | -0.389 | -0.140 | -0.615 | -0.489 | -0.819 | -0.500 | -0.757 |
| -N-P | 0.000 | -0.374 | -0.601 | -0.444 | -0.725 | -0.846 | -1.016 | -1.097 | -1.043 |
|
-N+P: Nitrogen starved in the presence of P-factor -N-P: Nitrogen starved in the absence of P-factor |