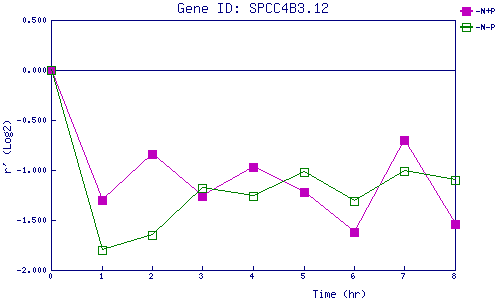
| 0 | 1 | 2 | 3 | 4 | 5 | 6 | 7 | 8 | |
| -N+P | 0.000 | -1.296 | -0.839 | -1.255 | -0.972 | -1.224 | -1.623 | -0.698 | -1.544 |
| -N-P | 0.000 | -1.797 | -1.651 | -1.183 | -1.256 | -1.016 | -1.308 | -1.011 | -1.102 |
|
-N+P: Nitrogen starved in the presence of P-factor -N-P: Nitrogen starved in the absence of P-factor |