| 0 | 1 | 2 | 3 | 4 | 5 | 6 | 7 | 8 | |
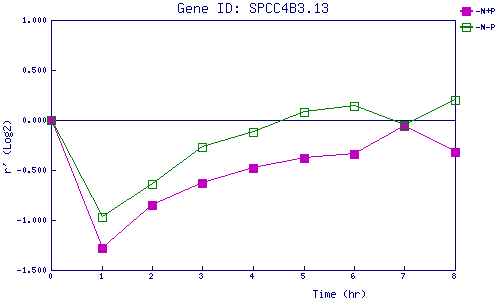
| -N+P | 0.000 | -1.285 | -0.846 | -0.629 | -0.478 | -0.379 | -0.337 | -0.062 | -0.321 |
| -N-P | 0.000 | -0.971 | -0.636 | -0.274 | -0.121 | 0.085 | 0.137 | -0.053 | 0.201 |
|
-N+P: Nitrogen starved in the presence of P-factor -N-P: Nitrogen starved in the absence of P-factor |