cwf20
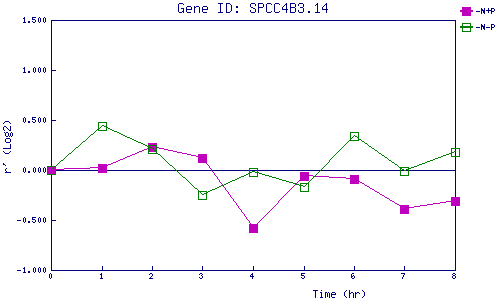
| 0 | 1 | 2 | 3 | 4 | 5 | 6 | 7 | 8 | |
| -N+P | 0.000 | 0.018 | 0.229 | 0.125 | -0.580 | -0.058 | -0.086 | -0.393 | -0.314 |
| -N-P | 0.000 | 0.437 | 0.213 | -0.248 | -0.025 | -0.170 | 0.345 | -0.012 | 0.182 |
|
-N+P: Nitrogen starved in the presence of P-factor -N-P: Nitrogen starved in the absence of P-factor |