| 0 | 1 | 2 | 3 | 4 | 5 | 6 | 7 | 8 | |
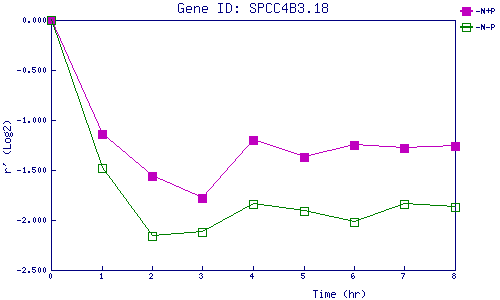
| -N+P | 0.000 | -1.140 | -1.558 | -1.785 | -1.205 | -1.374 | -1.254 | -1.284 | -1.258 |
| -N-P | 0.000 | -1.478 | -2.163 | -2.125 | -1.843 | -1.908 | -2.021 | -1.839 | -1.866 |
|
-N+P: Nitrogen starved in the presence of P-factor -N-P: Nitrogen starved in the absence of P-factor |