aph1
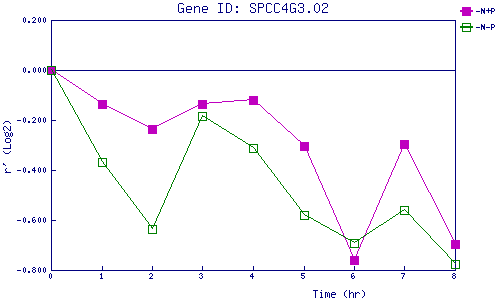
| 0 | 1 | 2 | 3 | 4 | 5 | 6 | 7 | 8 | |
| -N+P | 0.000 | -0.135 | -0.235 | -0.137 | -0.120 | -0.304 | -0.761 | -0.295 | -0.698 |
| -N-P | 0.000 | -0.366 | -0.635 | -0.185 | -0.311 | -0.581 | -0.692 | -0.562 | -0.776 |
|
-N+P: Nitrogen starved in the presence of P-factor -N-P: Nitrogen starved in the absence of P-factor |