coq5
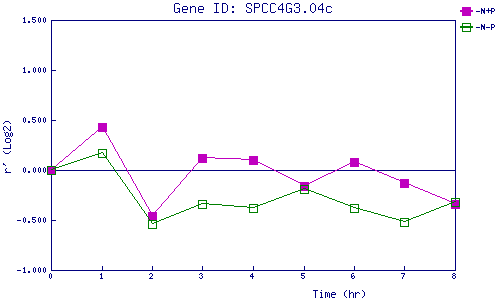
| 0 | 1 | 2 | 3 | 4 | 5 | 6 | 7 | 8 | |
| -N+P | 0.000 | 0.426 | -0.461 | 0.118 | 0.100 | -0.165 | 0.081 | -0.134 | -0.339 |
| -N-P | 0.000 | 0.174 | -0.539 | -0.342 | -0.381 | -0.192 | -0.376 | -0.522 | -0.318 |
|
-N+P: Nitrogen starved in the presence of P-factor -N-P: Nitrogen starved in the absence of P-factor |