| 0 | 1 | 2 | 3 | 4 | 5 | 6 | 7 | 8 | |
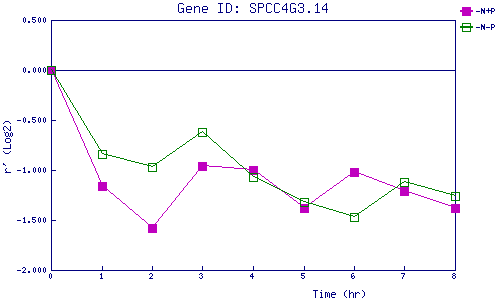
| -N+P | 0.000 | -1.161 | -1.586 | -0.964 | -0.997 | -1.378 | -1.025 | -1.214 | -1.378 |
| -N-P | 0.000 | -0.835 | -0.971 | -0.624 | -1.066 | -1.323 | -1.474 | -1.115 | -1.257 |
|
-N+P: Nitrogen starved in the presence of P-factor -N-P: Nitrogen starved in the absence of P-factor |