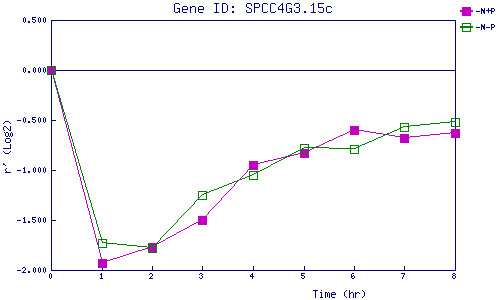
| 0 | 1 | 2 | 3 | 4 | 5 | 6 | 7 | 8 | |
| -N+P | 0.000 | -1.926 | -1.770 | -1.502 | -0.953 | -0.832 | -0.597 | -0.683 | -0.626 |
| -N-P | 0.000 | -1.730 | -1.779 | -1.250 | -1.049 | -0.776 | -0.787 | -0.567 | -0.522 |
|
-N+P: Nitrogen starved in the presence of P-factor -N-P: Nitrogen starved in the absence of P-factor |