| 0 | 1 | 2 | 3 | 4 | 5 | 6 | 7 | 8 | |
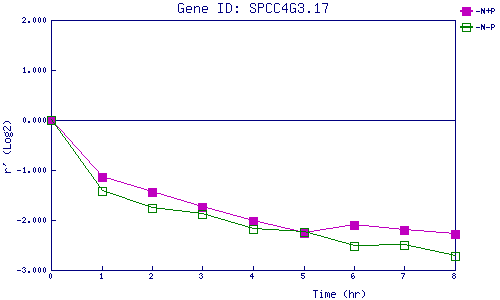
| -N+P | 0.000 | -1.143 | -1.439 | -1.740 | -2.021 | -2.256 | -2.109 | -2.210 | -2.286 |
| -N-P | 0.000 | -1.427 | -1.760 | -1.886 | -2.174 | -2.250 | -2.515 | -2.507 | -2.722 |
|
-N+P: Nitrogen starved in the presence of P-factor -N-P: Nitrogen starved in the absence of P-factor |