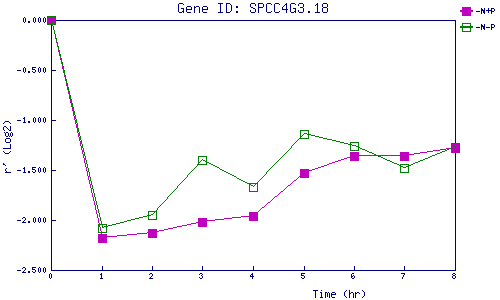
| 0 | 1 | 2 | 3 | 4 | 5 | 6 | 7 | 8 | |
| -N+P | 0.000 | -2.184 | -2.127 | -2.025 | -1.958 | -1.526 | -1.363 | -1.357 | -1.284 |
| -N-P | 0.000 | -2.083 | -1.951 | -1.395 | -1.670 | -1.144 | -1.257 | -1.477 | -1.267 |
|
-N+P: Nitrogen starved in the presence of P-factor -N-P: Nitrogen starved in the absence of P-factor |