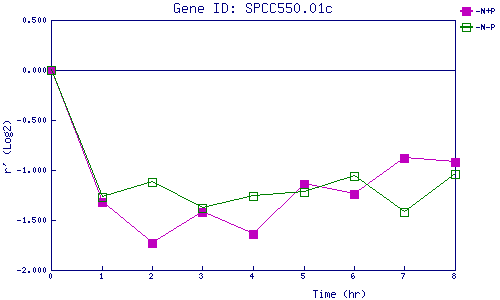
| 0 | 1 | 2 | 3 | 4 | 5 | 6 | 7 | 8 | |
| -N+P | 0.000 | -1.316 | -1.727 | -1.421 | -1.641 | -1.144 | -1.240 | -0.881 | -0.921 |
| -N-P | 0.000 | -1.271 | -1.118 | -1.385 | -1.264 | -1.223 | -1.061 | -1.425 | -1.035 |
|
-N+P: Nitrogen starved in the presence of P-factor -N-P: Nitrogen starved in the absence of P-factor |