cwf5 ecm2
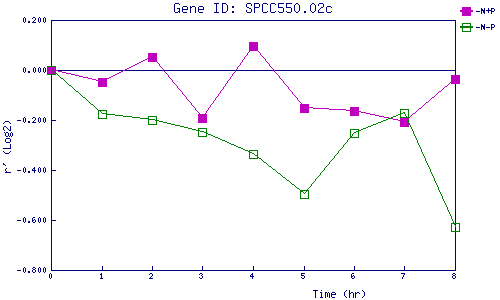
| 0 | 1 | 2 | 3 | 4 | 5 | 6 | 7 | 8 | |
| -N+P | 0.000 | -0.049 | 0.052 | -0.194 | 0.097 | -0.152 | -0.163 | -0.209 | -0.035 |
| -N-P | 0.000 | -0.176 | -0.200 | -0.248 | -0.335 | -0.496 | -0.252 | -0.172 | -0.628 |
|
-N+P: Nitrogen starved in the presence of P-factor -N-P: Nitrogen starved in the absence of P-factor |