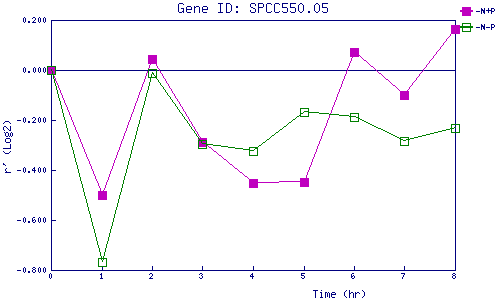
| 0 | 1 | 2 | 3 | 4 | 5 | 6 | 7 | 8 | |
| -N+P | 0.000 | -0.500 | 0.044 | -0.287 | -0.452 | -0.448 | 0.073 | -0.100 | 0.165 |
| -N-P | 0.000 | -0.767 | -0.013 | -0.297 | -0.324 | -0.169 | -0.189 | -0.285 | -0.232 |
|
-N+P: Nitrogen starved in the presence of P-factor -N-P: Nitrogen starved in the absence of P-factor |