hsp10 Tf2-fragment5
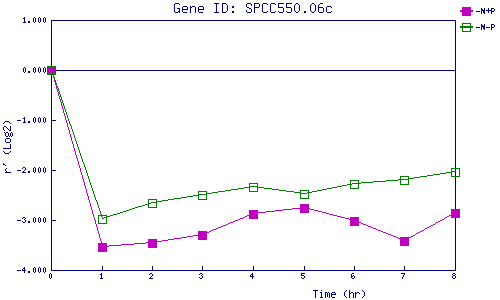
| 0 | 1 | 2 | 3 | 4 | 5 | 6 | 7 | 8 | |
| -N+P | 0.000 | -3.544 | -3.457 | -3.306 | -2.879 | -2.756 | -3.018 | -3.428 | -2.869 |
| -N-P | 0.000 | -2.974 | -2.654 | -2.500 | -2.339 | -2.485 | -2.273 | -2.200 | -2.036 |
|
-N+P: Nitrogen starved in the presence of P-factor -N-P: Nitrogen starved in the absence of P-factor |