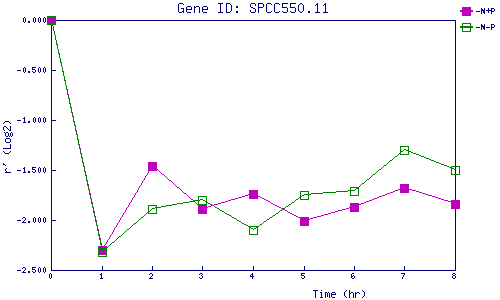
| 0 | 1 | 2 | 3 | 4 | 5 | 6 | 7 | 8 | |
| -N+P | 0.000 | -2.298 | -1.465 | -1.890 | -1.745 | -2.014 | -1.867 | -1.677 | -1.837 |
| -N-P | 0.000 | -2.321 | -1.888 | -1.797 | -2.098 | -1.754 | -1.709 | -1.305 | -1.500 |
|
-N+P: Nitrogen starved in the presence of P-factor -N-P: Nitrogen starved in the absence of P-factor |