him1
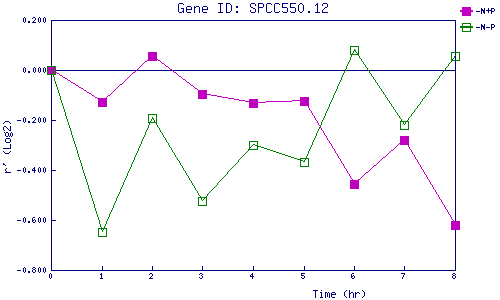
| 0 | 1 | 2 | 3 | 4 | 5 | 6 | 7 | 8 | |
| -N+P | 0.000 | -0.127 | 0.054 | -0.096 | -0.132 | -0.124 | -0.458 | -0.281 | -0.621 |
| -N-P | 0.000 | -0.650 | -0.193 | -0.523 | -0.301 | -0.366 | 0.079 | -0.219 | 0.054 |
|
-N+P: Nitrogen starved in the presence of P-factor -N-P: Nitrogen starved in the absence of P-factor |