rad35 dfp1
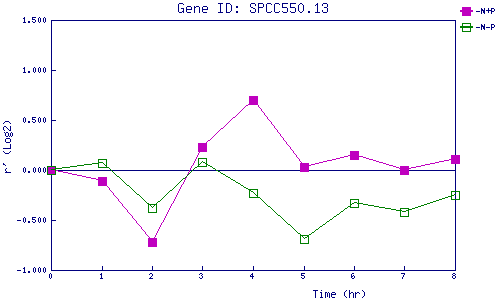
| 0 | 1 | 2 | 3 | 4 | 5 | 6 | 7 | 8 | |
| -N+P | 0.000 | -0.107 | -0.718 | 0.234 | 0.697 | 0.026 | 0.149 | -0.002 | 0.114 |
| -N-P | 0.000 | 0.068 | -0.382 | 0.078 | -0.231 | -0.694 | -0.327 | -0.420 | -0.253 |
|
-N+P: Nitrogen starved in the presence of P-factor -N-P: Nitrogen starved in the absence of P-factor |