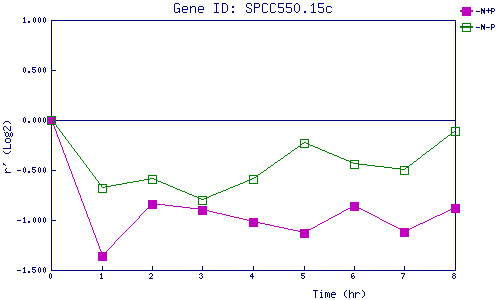
| 0 | 1 | 2 | 3 | 4 | 5 | 6 | 7 | 8 | |
| -N+P | 0.000 | -1.357 | -0.841 | -0.904 | -1.017 | -1.133 | -0.856 | -1.120 | -0.884 |
| -N-P | 0.000 | -0.685 | -0.589 | -0.801 | -0.593 | -0.226 | -0.437 | -0.495 | -0.110 |
|
-N+P: Nitrogen starved in the presence of P-factor -N-P: Nitrogen starved in the absence of P-factor |