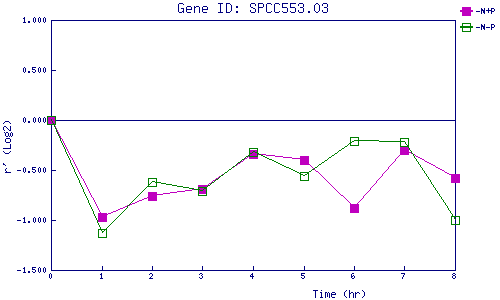
| 0 | 1 | 2 | 3 | 4 | 5 | 6 | 7 | 8 | |
| -N+P | 0.000 | -0.972 | -0.756 | -0.693 | -0.345 | -0.401 | -0.876 | -0.296 | -0.580 |
| -N-P | 0.000 | -1.129 | -0.615 | -0.713 | -0.318 | -0.561 | -0.210 | -0.217 | -1.001 |
|
-N+P: Nitrogen starved in the presence of P-factor -N-P: Nitrogen starved in the absence of P-factor |
