wtf6 wtf2-pseudo
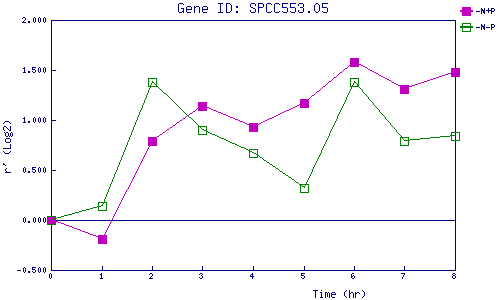
| 0 | 1 | 2 | 3 | 4 | 5 | 6 | 7 | 8 | |
| -N+P | 0.000 | -0.191 | 0.786 | 1.141 | 0.933 | 1.169 | 1.577 | 1.309 | 1.484 |
| -N-P | 0.000 | 0.144 | 1.383 | 0.898 | 0.671 | 0.321 | 1.380 | 0.787 | 0.845 |
|
-N+P: Nitrogen starved in the presence of P-factor -N-P: Nitrogen starved in the absence of P-factor |