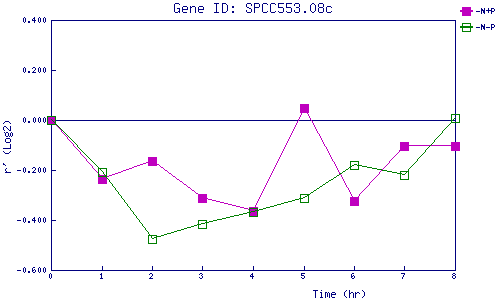
| 0 | 1 | 2 | 3 | 4 | 5 | 6 | 7 | 8 | |
| -N+P | 0.000 | -0.235 | -0.165 | -0.311 | -0.363 | 0.049 | -0.323 | -0.103 | -0.105 |
| -N-P | 0.000 | -0.210 | -0.476 | -0.414 | -0.369 | -0.310 | -0.181 | -0.221 | 0.008 |
|
-N+P: Nitrogen starved in the presence of P-factor -N-P: Nitrogen starved in the absence of P-factor |